
This is the 3rd and final part in a series on promoting equity in your rate structure and protecting your most vulnerable citizens.

In part one of the series, we introduced the concept of water affordability, that equality is not the same as equity, and described the industry’s perspective on cross-class subsidies as an answer to balance the scales of affordability in your community.
In part two, we broadly defined three levels of water usage, and by analyzing their distribution across a utility’s billing data, propose that these groups may not be charged equitably if a rate structure’s individual rates and tier thresholds are not set optimally. We further explored how the water industry measures affordability and how to identify vulnerable rate payers in your own community.
Lastly, in this third and final part, we tie all of these concepts together to explain how, with proper assessment of your community’s financial capability and analysis of your billing data distribution, you can utilize cross-class subsidies to promote affordability and equity for your rate payers.
Are your rate tier thresholds causing “essential” users to pay too-high prices?
What does this chart mean?
Remember this billing distribution graph we showed in part 2? The y-axis represents the number of bills a utility issued during a certain billing period, and the x-axis represents the volume of water delivered to those customers in US gallons. The corresponding data visualization illustrates three broad groups of water users: the essential, moderate, and excessive groups.
Figure 1 (click to enlarge)
It’s a great visual aid that depicts these three large groups, and can help you determine where your tier thresholds should be.
Now in the graph below, the y-axis has now been filtered for “Billed Revenue”. The mode (the peak) represents the most common number in a data set — in this case, that is level of water consumption. So, at a 30,000-foot analysis, you may accept that this point represents “moderate” users in your community and that all lower usage levels to the left of this point represent “essential” users.
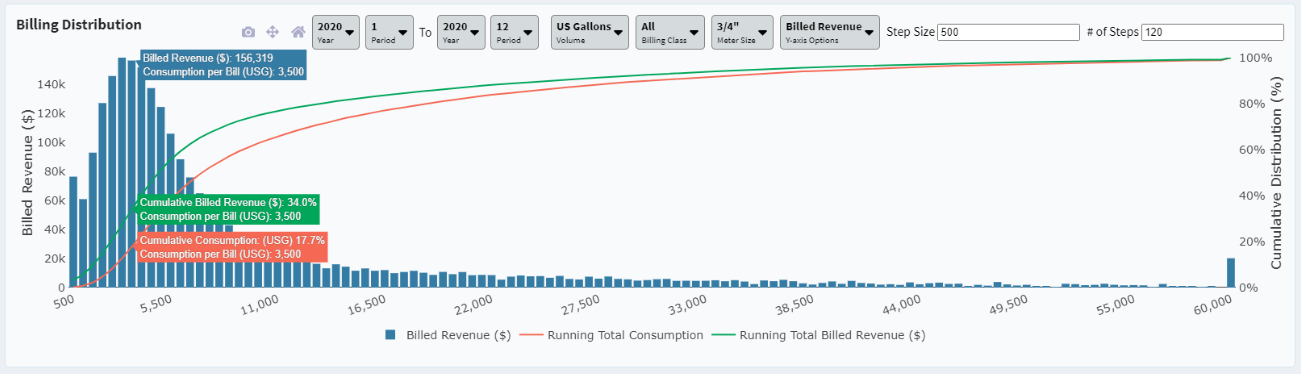
Figure 2 (click to enlarge)
Side note: You can go a step deeper by modeling only revenue from variable rates, assuming that the fixed portion of your rate structure solely covers your fixed costs.
Why does this chart matter?
Figure 2 shows us that 17.7% of the total billed consumption for this period contributed 34% of total revenue. In other words, this low usage that we have label “essential” of 17.7% is contributing to over a third of total water revenues for the entire community.
As previously expressed, all life needs water to survive; there is only so little you can consume or so much you can conserve. This same scenario can also be inverted to show that the remaining 82.3% of consumption is responsible for just 66% of the total water revenue — despite using more of the water supply.
Why should you as a water utility manager care?
Because while water systems are complicated and expensive, charging so disproportionately for a conservative amount of a resource that humans cannot live without, may not be equitable.
This analysis provides valuable high-level insight into equity and affordability at a glance. It may inform you that those who have higher usage and (assumingly) more means to pay for it, may not currently be paying an equitable rate and contributing an equitable proportion of total revenues, given their excessive consumption. Whereas those who risk being unable to afford their water bill may be paying more than their fair share given their conservative consumption.
If this can be changed and addressed at its source (your rate structure, ie. rates themselves and tier thresholds), then there will also be less dependency on supplemental programs aimed at subsidizing low-income rate payers. This can be done without threatening your cash position, too, simply by shifting from what level of usage revenues are collected to be more equitable.
This type of analysis in a dynamic financial modeling tool gives you the flexibility to model any number of changes to rate and tier thresholds, by meter size, billing class, or season. And by testing changes against your own billing data, you can have confidence that the changes you propose will deliver on goals for revenue, equity, and affordability.
Raising rates to protect vulnerable rate payers
The jump in price for rate payers between usage groups might appear like a big one — especially between ‘essential’ and ‘moderate’ users — if the threshold is not set appropriately. If your first tier threshold is too low, your essential (and likely most economically vulnerable) users end up paying significantly more because part of their usage dips into a higher rate tier.
On the flip side, and more importantly, if your upper volume thresholds are set too high, or the rates in your ‘excessive’ group are not high enough, those users may not be adequately incentivized to reduce their usage (if water conservation is an objective for your community). This is where appropriately set tier thresholds and cross-class subsidies come into play to make rate setting equitable and affordable.
In our example, users and rate payers in the excessive group are using a significant amount of water and resources, despite making up a small proportion of total users, and paying much less comparatively, despite their high usage level. If your state regulations allow, implementing cross-class subsidies could mean increasing lower rate tier thresholds, potentially reducing lower tier rates, lowering upper tier thresholds, and raising upper tier rates. This collects additional revenue from those who fall into the excessive range, and subsidizes those who fall in the essential range.

Figure 3: Vertical blue lines represent rate tier thresholds (click to enlarge)
As a generic example, reducing the essential user’s variable rate by $1, and increasing excessive’s by $1, sends a message about water affordability and excessive usage, without hurting your cash position by simply ‘lowering rate costs’. Although there are fewer excessive users, they consume more gallons of water; generally speaking, in this example, this type of compensation would balance out financially, as well as lower the burden for vulnerable rate payers, and incentivize excessive users to reduce their consumption and participate in water conservation.
You don’t have to lower one and raise the other simultaneously, either; lowering upper-tier thresholds and increasing individual rates in that tier would also be an effective method. The key here is that where the revenue is coming from is shifting, either by changing tier thresholds, or by adjusting the prices, or a combination of the two. Moreover, as described in part 1, rate payers with the funds to pay excessive rates, can absorb a larger toll better than rate payers in the essential group.
Where do we go from here?
You want to create the best of both worlds, not over-burden your rate-payers, but also deliver clean, safe, uninterrupted water services and fund your future projects, all while remaining financially solvent.
Not increasing rates isn’t an option; operation and maintenance costs persist, and infrastructure does not cease to age. So cross-class subsidization allows for more equitable and proportionate billing for rate payers, based on their consumption. Doing so proactively would also help prevent intergenerational inequity. “If services are underpriced today, future generations will have to pay more of the service provider’s capital costs than their share of the benefits
would indicate, since payments toward those costs have been deferred (and assets not properly maintained or replaced).” If your State regulations allow it, utilizing cross-class subsidies could provide a solution for long-standing and deferred financial issues, address present concerns and inequities and conservation, as well as help prevent future issues from occurring.
By implementing a cloud-based, dynamic financial model, you can test different potential scenarios, and ensure that your rate structure is collecting sufficient revenues for both your current costs and future projects, while protecting your most vulnerable rate payers.
Leave a Reply